
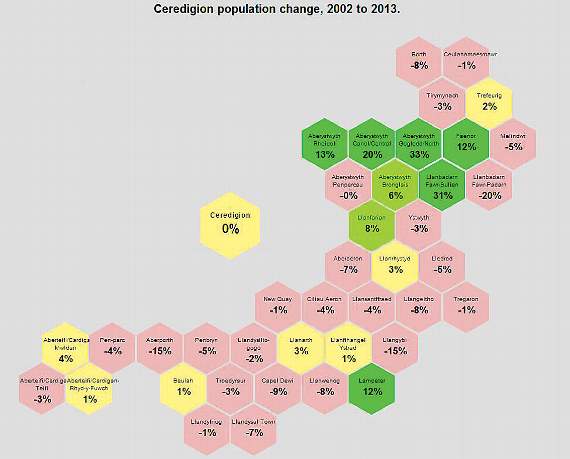
A SERIES of “Hexmaps” shows the changing face of Ceredigion, including the dramatic movement of the county’s population from rural to urban areas.
Using open data, software developer Tom Forth created a series of Hexmaps — a map composed of hexagons, each representing an electoral ward — to visualise a variety of economic indicators, giving an interesting overview of Ceredigion.
One map, which visualises population change between 2002 and 2013, indicates a significant increase of 33 per cent in the population of Aberystwyth North ward, alongside decreases in the surrounding rural areas.
These include, for example, Borth, which has seen a decrease of eight per cent; Melindwr, with a similar decrease of five per cent, and Ystwyth, with a drop of three per cent.


.png?width=209&height=140&crop=209:145,smart&quality=75)
This a is a pattern repeated across the county, albeit on a smaller scale.
For example, Lampeter has seen an increase of 12 per cent in its population, while neighbouring Llangybi ward’s population has decreased by 15 per cent. And Cardigan Mwldan’s population has increased by four per cent while Penparc has seen a drop by the same percentage.
Interestingly, the highest average wages (£490 per week) after housing costs, are to be found in the north of the county, in the rural areas near Aberystwyth.
The lowest average wages (£370 per week) are found in Cardigan’s three wards — Mwldan, Teifi and Rhyd-y-Fuwch — as well as in the neighbouring wards of Penparc and Aberporth.
See the Cambrian News for the full story, in shops and online now
Comments
This article has no comments yet. Be the first to leave a comment.